Halo, Halo, Halo
Statchat
1 December 2015
The “halo effect” whereby properties in cities and small towns close to Auckland are experiencing rapid price growth as buyers are forced out of an overheated Auckland market has created much talk in recent months.
While the focus is generally on price increases, it is interesting to note what is happening in terms of sales volumes and days to sell. When one statistic fails to conform to the pattern it is time to drill down a bit further.
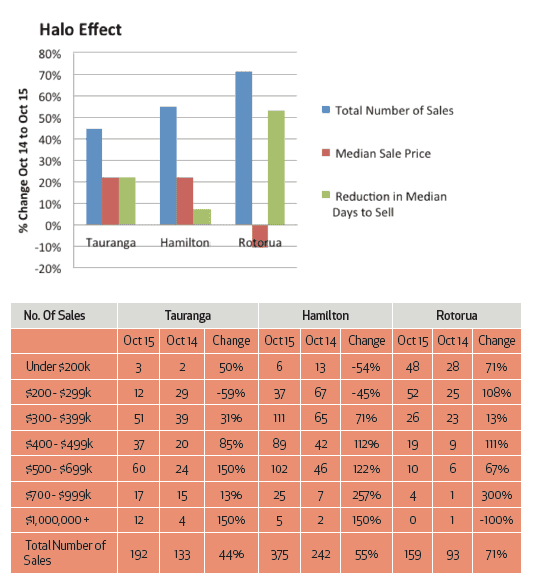
Between October 2014 and October 2015, the total number of properties sold increased 44% in Tauranga, 55% in Hamilton and a whopping 71% in Rotorua. Median days to sell decreased by 22%, 7% and 53% respectively.
But while median sale price increased by 22% for Tauranga and Hamilton it actually decreased 11% for Rotorua. How can this be? To answer this it is necessary to look at where the action is happening in terms of sales price bands. This can also help gauge to what extent the halo is being driven by investors as opposed to other buyers and how that varies from one centre to another.
EVES Realty are leading realtors based in the Waikato and Bay of Plenty regions and circulated some interesting statistics from REINZ in their latest Property Beat newsletters.
The table shows total sales under $300,000 fell from 31 to 15 in Tauranga and from 80 to 43 in Hamilton, for the year to October 2015. Conversely, in Rotorua sales in this range increased from 53 to 100.
A greater proportion of total sales falling in the lower price bands led to the unhalo-like outcome of median selling price actually dropping in Rotorua over the year despite the dramatic increase in sales numbers and reduction in days to sell. It will be interesting to see how this pattern progresses over the coming year.


