All Quiet On The Sales Front
Sally Lindsay discovers that despite a market slump intensified by poor weather, there are reports of more active buyers.
28 February 2023
January house sales plunged to their lowest levels, excluding the first pandemic lockdown in 2020 when buyers and sellers came to a virtual standstill.
The latest REINZ data shows just 2,759 residential properties were sold nationally last month, down 27 per cent compared to the same time last year.
The number of residential property sales across the country declined month-on-month by 38.7 per cent, and 27 per cent year-on-year.
REINZ chief executive Jen Baird says the January sales slump was intensified by Auckland’s poor weather. Just 943 properties in the city changed hands during the month, the lowest since records began.
Across the country Manawatu/Whanganui, Northland, Waikato and Southland had the second lowest sales month since records began.
House prices are also falling. In Auckland, property prices dropped under $1 million to $940,000 in January for the first time in two years.
REINZ’s figures show that nationally the median price for residential property dropped 13.3 per cent annually to $762,500 and declined 9.3 per cent for New Zealand, excluding Auckland, to $679,000.
The House Price Index (HPI) showed an annual drop of 13.9 per cent in January in line with sale price changes.
Over 14 of the past 15 months, Wellington has been ranked as the worst for year-on-year HPI movement, while most of country, apart from Auckland, Bay of Plenty and Manawatu/Whanganui, had their biggest year-on-year HPI drops since records began.
Nationally, there was a 16 per cent drop of new listings from 7,912 in January last year to 6,646 new listings in January this year and an increase of 28.9 per cent compared to December last year.
However, at the end of January, 27,732 properties were available for sale across NZ, a whopping annual increase in inventory of 39.4 per cent. For NZ, excluding Auckland, there was a staggering annual increase of 55.9 per cent (17,781 properties).
This indicates there are far more properties for sale than buyers, which is not going to improve for a while.
This flows into the median number of days to sell a property, which last month was 53; 16 days longer than in January last year.
‘In Auckland, property prices dropped to $940,000 in January’
MORE ACTIVITY
Baird says reports of more activity in the market are growing. “Agents in many areas are reporting more attendance at open homes, more interest online and even more multi-offer situations.”
She says it seems there are more buyers active in the market. “February and March data will tell us if they choose to act.”
Baird says the latest data does indicate a slowing of the decline. “The coming months will be telling as the country braces for more activity both in the weather and the property market.”
While for the first two months of the year REINZ has claimed house price drops are stabilising, QV says those claims have been quashed by a 1.1 per cent fall in January.
QV says the drop nationally suggests a steeper decline and put the annual drop in prices at 12.1 per cent.
Chief operating officer David Nagel says it looks as though the bottom of the market has not been reached yet. He says no-one is arguing whether price falls are happening, just the magnitude of those falls.
Palmerston North and Hastings had the biggest falls of 3.3 per cent and 3 per cent respectively for the three months to the end of January.
The Wellington region was also hard hit with an average house price fall of 2.8 per cent over the three months and a decline of 20.4 per cent annually.
In the Auckland region house prices were on average 14.3 per cent lower than at the same time last year.
Price falls also hit Christchurch and were down 1.3 per cent to an average price of $849,097 for the three months to the end of January.
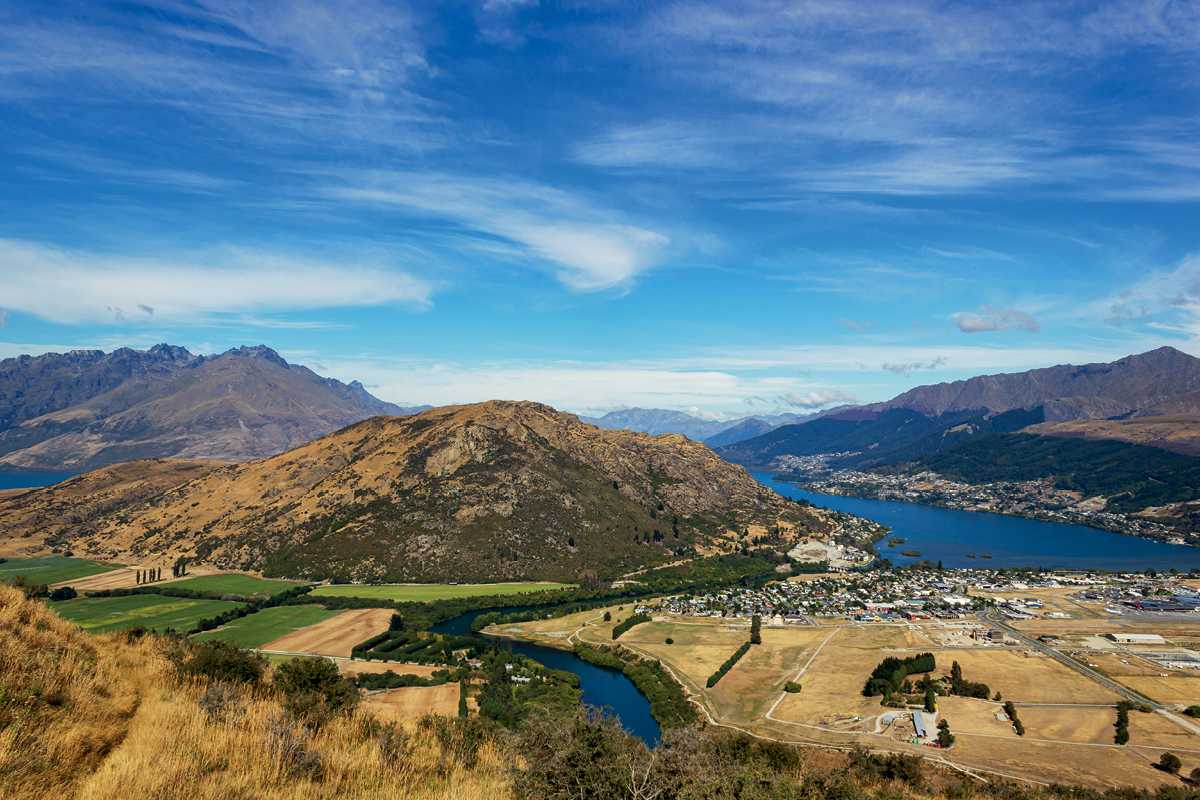
Queenstown had its first quarterly house price drop, with values falling on average 0.7 per cent.
‘Building cost inflation has hit a record annual high’
BUILDING INFLATION
Building cost inflation has hit a record annual high of 10.4 per cent, the first double digit annual figure since the index was launched 10 years ago.
While the CoreLogic Cordell Construction Cost Index (CCCI) recorded an increase of 1.7 per cent in the final quarter of last year, a significant drop from the record 3.4 per cent rise in the three months to September, it still hit the new all-time high, surpassing the previous record of 9.6 per cent set in the third quarter.
The CCCI report measures the rate of change of construction costs within the residential market for a typical, standard three-bedroom, two-bathroom brick and
tile single-storey dwelling.
Annual inflation for construction costs is expected to hold at about 10 per cent for the first quarter of this year, says CoreLogic’s chief property economist Kelvin Davidson, before easing over the rest of the year as the red-hot residential building sector finally starts to slow.
“However, in a market where existing house values are dropping, it may well be difficult for builders to keep pushing up new-build prices to compensate for higher costs. If so, the net result of continued increases in construction costs, even if at a slower pace, would be further pressure on construction firms’ profit margins,” he says.
Rent increases slowed significantly last year when compared to 2021, the latest Trade Me rent index shows.
That is of cold comfort to landlords struggling with increasing tax and other costs.
Rents rose 0.9 per cent in the December quarter and are up 4.4 per cent over the past year. Rent is the biggest single item in the Consumers Price Index, accounting for just under 10 per cent of the basket. The CPI rose 1.4 per cent in the December quarter to 7.2 per cent over the past year, slightly down on the previous quarter.
Trade Me Property’s rental index shows the national median rent across the country stayed at $580 in December and had been the same since September. That was $10 more than January last year.
Sales director Gavin Lloyd says the $20 price increase in the national median rent between December 2021 and the end of last year was only half the size of the rise the year before when the median rent rose from $520 in December 2020 to $560 in December 2021.
Last year rents were up annually in every region of the country apart from Wellington, with Northland showing the biggest increase of 12 per cent to $560 in December. That was $60 more than in January.
Wellington still has the most expensive median weekly rent at $560. It was up 3.2 per cent annually, but unchanged from the beginning of the year in dollar terms.
THE RENTAL SCENE
In the Auckland region the median weekly rent grew 3 per cent annually to reach a new high of $615 in December. This comes after rents remained stagnant for more than 12 months, fluctuating between $600 and $610 since October 2021.
Rents were up 11 per cent to $555 in Nelson-Tasman, followed by Marlborough with a 9.2 per cent annual increase to $535.
In dollar terms, Manawatu/Whanganui and Taranaki also had large rent increases since January last year, up $45 and $40 to $515 and $550 a week.
Rental supply was up nationwide for the ninth month in a row, with a 2 per cent annual increase in the number of rental properties listed on Trade Me in December. At the same time, demand was down nationwide by 2 per cent in December.


